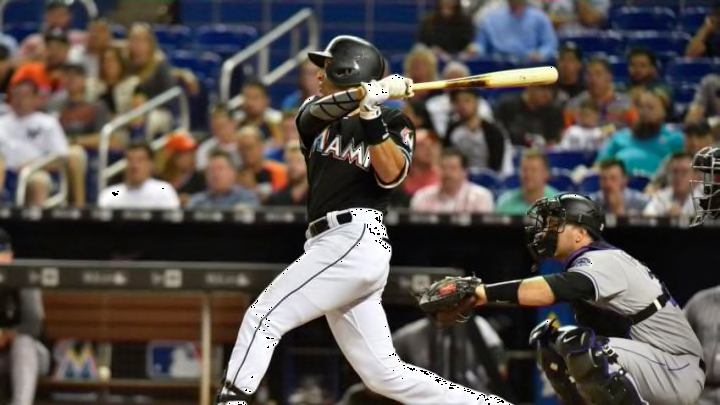
After starting the season 5-17, the Miami Marlins have won six of their last eight to climb to 11-19.
That’s better than the Cincinnati Reds, the San Diego Padres, the Baltimore Orioles, the Chicago White Sox, and the Kansas City Royals. Yes. I’m now bragging about being a fan of the 25th best team in baseball. Initial projections have colored Miami Marlins Nation expectations, and labelling this team “not the worst in baseball” may be the best we can hope for. But I digress.
I used the Wins Probability Added metric (WPA) to help ascertain which players performed better (or worse) in the higher leverage situations. In other words, if the Miami Marlins are winning, 6-0, a plate appearance doesn’t count as much. Conversely, an at bat with two on and two out in the bottom of the 13th has a very high leverage.
There’s something else you need to understand about WPA. Every game has a collective WPA of zero. The winning team will finish with a total of .50, and the losing team will have -.50. It doesn’t matter if the two teams combine for 50 runs or it finishes at 1-0, the WPA will still add up to zero. Also of interest, if two clubs split a two game series, each team’s individual WAR will also be a collective zero. At the end of a 162 season, in fact, an 81-81 club will have a mark of, you guessed it, zero.
WPA is not a great predictor of future performance. What it can tell you is which players performed best when the chips were down. As such, it’s a great metric for telling the story of one ballgame, or in this setting, one series. In these games, blowouts both, an early inning plate appearance, when the game was close, is worth much more than a plate appearance near the end. We’re going to take a closer look at Miami’s 22 participants in their series against the Philadelphia Phillies. Click here for a look at their last series, versus the Colorado Rockies.
